|
Presentation
of the statistical information
In statistics windows two types of the data are displayed
- Statistics on packets with mistakes
- Statistics on work of filters
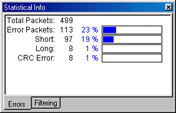
The statistics on mistakes displays:
- The number of packets
- The number of packets with mistakes
- The number of packets with a mistake CRC
- The number of short packets
- The number of long packets
There is also a percentage ratio between these sizes and a diagram which can
be of two kinds: bar or circular.

Fig. 11. Window of statistics. The statistics on mistakes is
displayed.
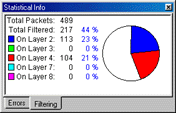
The statistics on filters displays: the number of packets, the number of packets
filtered in general and at each level.

Fig. 12. Window of statistics. The statistics on filters is
displayed.
|